As part of our ongoing experiments in visualization, I recently rebuilt a personal website using Omeka (or more specifically what they’re now calling “Omeka Classic”), a lightweight web publishing platform for digital collections from George Mason University’s Roy Rosenzweig Center for History and New Media. Previous exposure suggested that, by itself, it could make a decent digital asset management add-on to an existing site due to its metadata support. In this instance I wanted to discover the benefits Omeka offers when treating our corpus of plain text files as an online collection.
As it happens, there are a number of very nice plugins extending the functionality of Omeka, and several are specifically designed for text analysis and visualization. With the file content attached as an item type metadata (in this case the textual component), I was able to use the Ngram plugin to analyze term frequency and plot it over time.
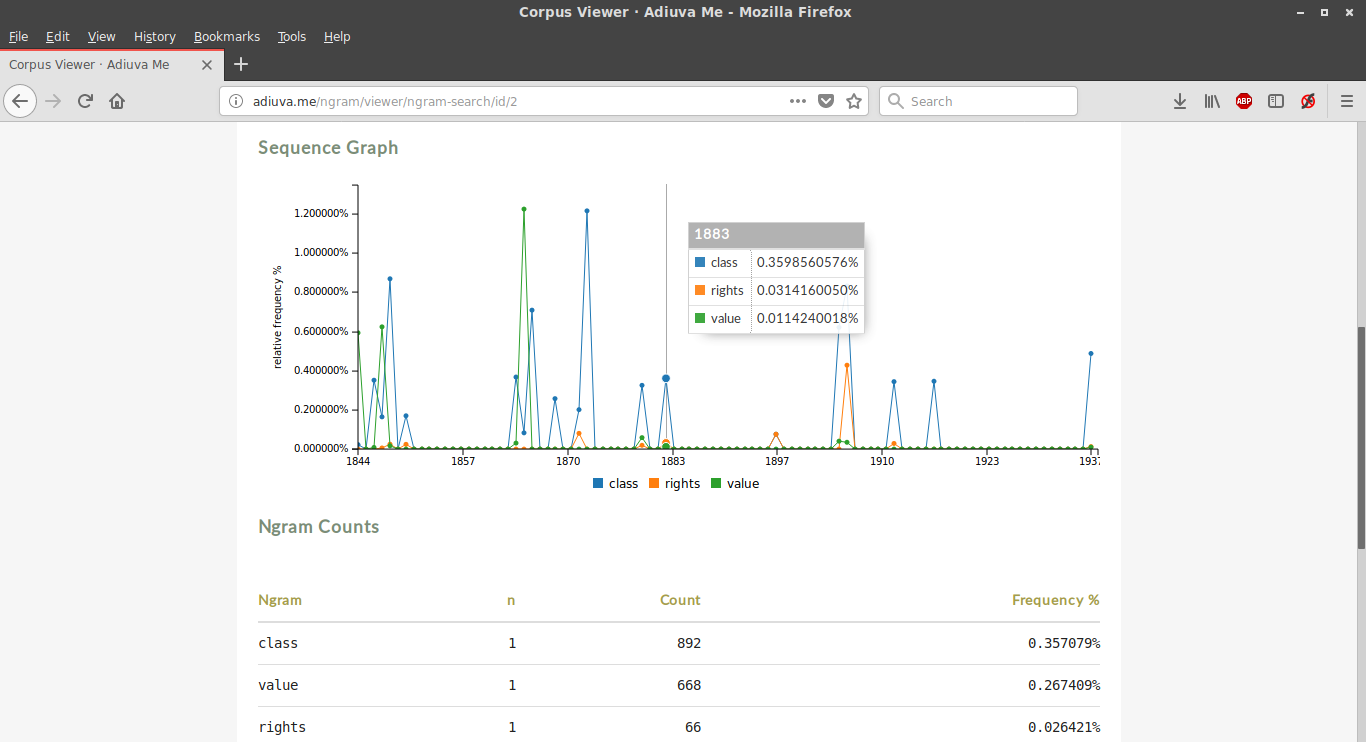
Incorporating time was necessary in order to generate a graph with a horizontal axis, and to satisfy that requirement I used the “date created” metadata field. Unfortunately this resulted in each year representing a different text, since they were largely published a year or more apart. It’s possible to generate an Ngram corpus without a date range, but for visualization purposes frequency over time is more interesting.
Another drawback to the plugin was the inability to remove stopwords, such as “a,” “the,” and “and.” However, if you search the collection using your own comma separated lists of keywords, as unigrams (single words), bigrams (two adjacent terms) or trigrams (three word combinations), the results are much more interesting.
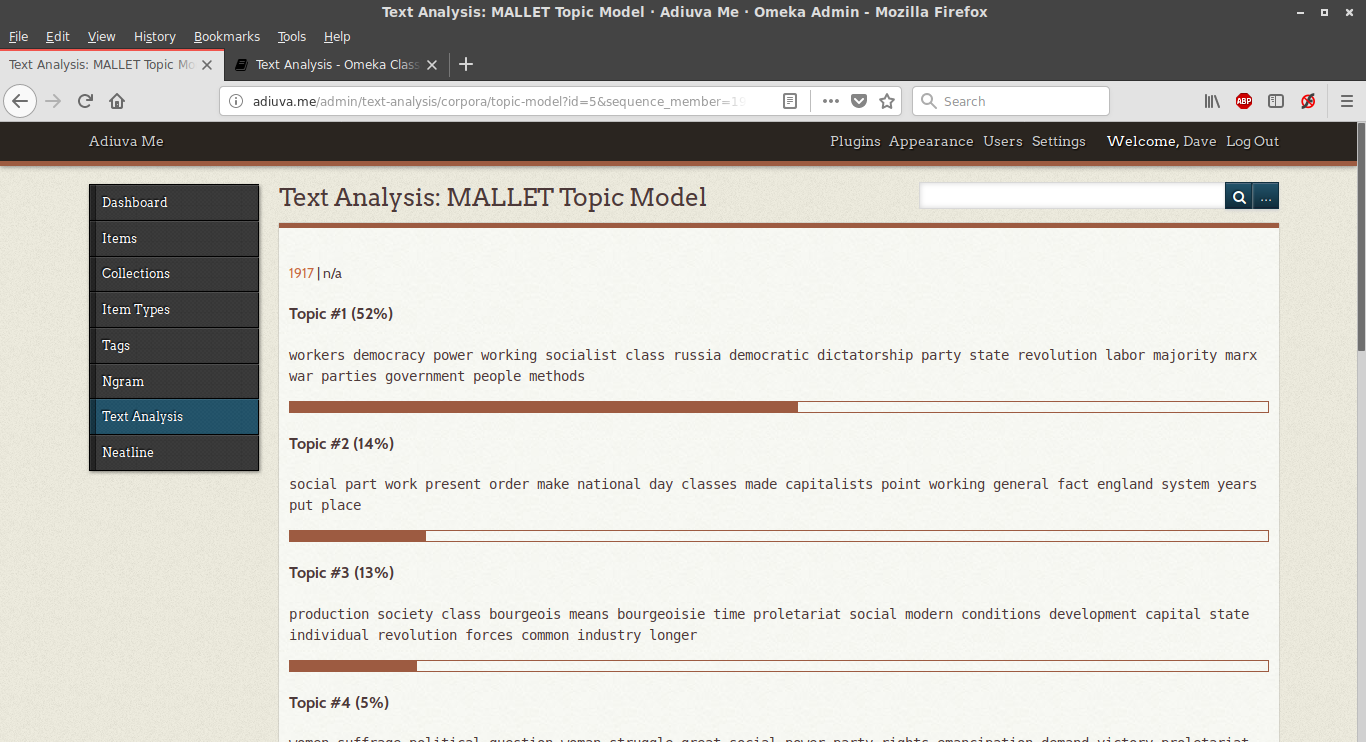
The Ngram corpus was necessary for using the aptly-named Text Analysis plugin. Taking the generated concordance, it provided a list of top-ten topic models generated by a local instance of MALLET, one for each document (a.k.a. each “year”):
Another option provided by the plugin was querying the interface of IBM’s Watson Natural Language Understanding service, offering a list of identified entities (people, places, and things), keyword sentiment analysis, and high-level concepts sorted by relevance.
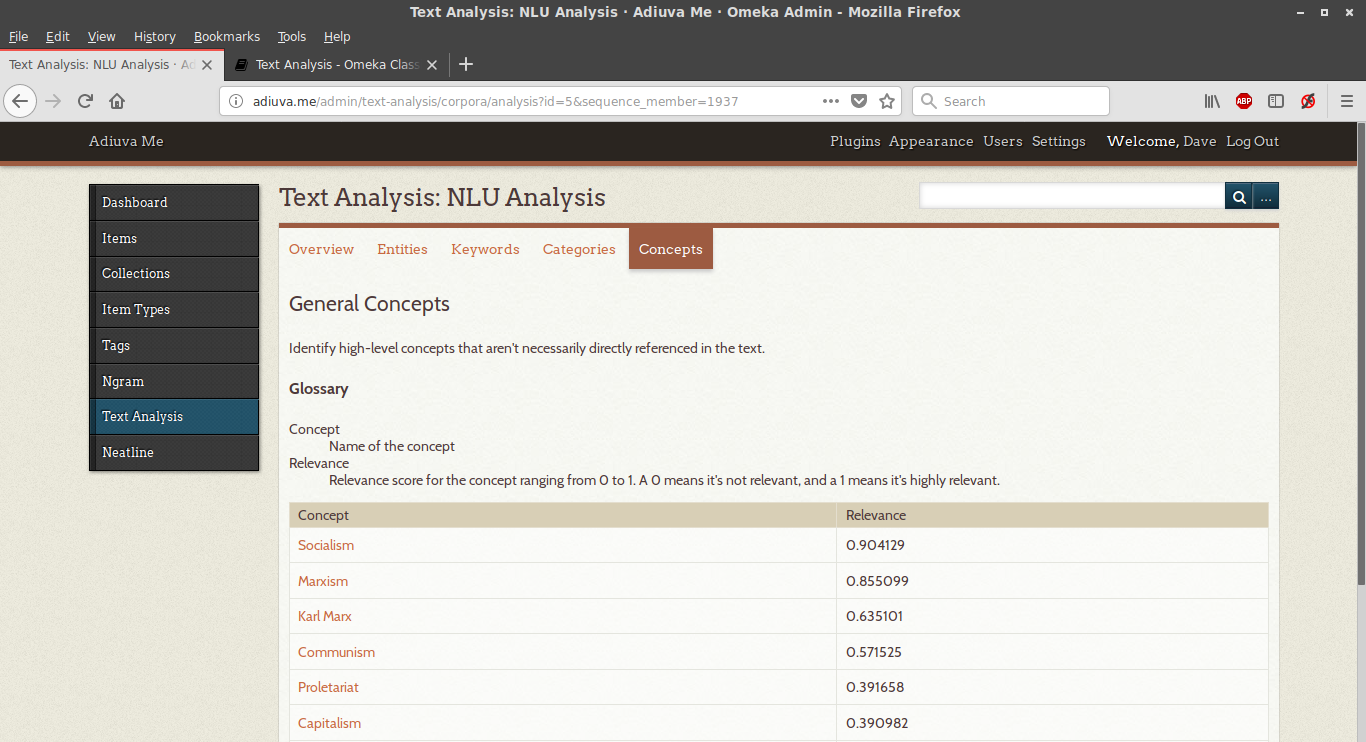
If there’s a drawback to this plugin, it’s that the results aren’t accessible to site visitors: only logged in users can see and generate analytic tables, probably due to the fact that the IBM service isn’t free beyond minimal usage.
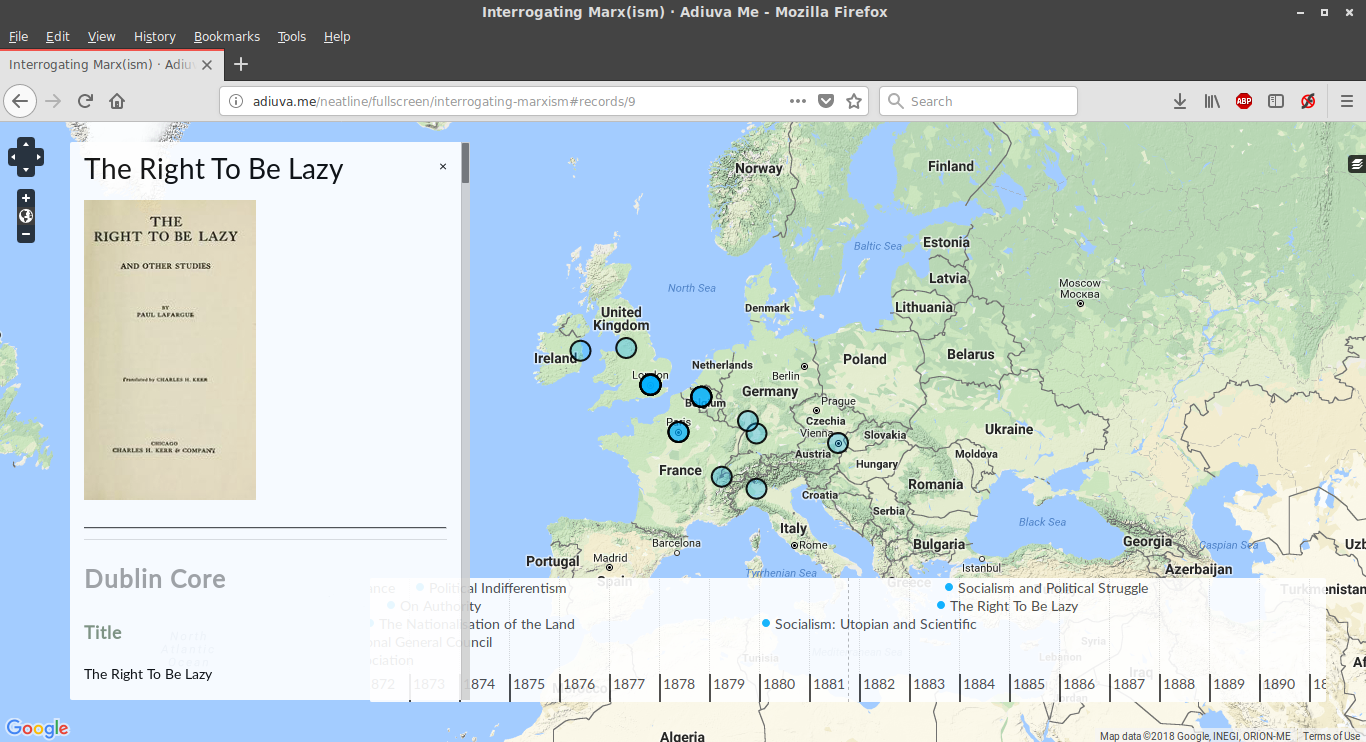
Finally, one of the more visually appealing plugins is Neatline, a framework for creating interactive exhibits using maps and MIT SIMILE project-style timelines. Although a bit labor-intensive, as it relied on manually reproducing some of the metadata within its interface, the results were not so much interpretive as illustrative, displaying how items in the corpus related to each over space and time.
For those interested in examining these features directly, the site is http://adiuva.me/, with the Ngram corpus viewer accessible at http://adiuva.me/ngram/corpora/show/id/2 and the Neatline map at http://adiuva.me/neatline/show/interrogating-marxism. Please let us know what you think!
Really Informative Content, Thanks for sharing this!
Pingback: Learn Forget Backlink 1 – Scholarship
Neatline is another important plugin.
when i read this article, i felt something interesting, maybe i will share this to others too.
Registration here is really fast and easy. No need to be complicated, you can immediately start exploring many exciting gacor slot games. The platform is also easy to navigate