Another possibility for visualizing relationships between texts is to consider how similar the combinations of related terms among them can be. To accomplish this, experiments were conducted generating network diagrams.
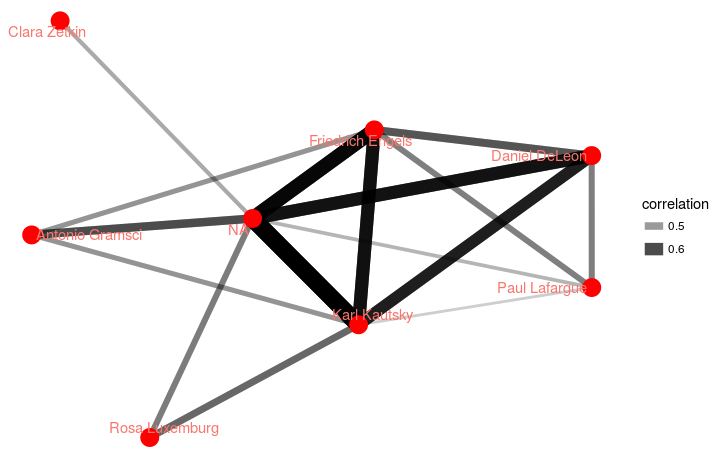
This diagram uses pairwise correlations to examine the term frequencies in each author’s work, via the tidygraph and ggraph R packages. The nodes represent authors, with edge density indicating correlation strength — how strongly related variables are, using values between 1 (strongly related to the point of being almost identical) and 0 (not connected or dependent at all). To reduce visual clutter, only correlations higher than 0.4 are considered. Based on this criterion, one possible interpretation of the graph suggests that Kautsky used similar terms at a similar rate as Engels.
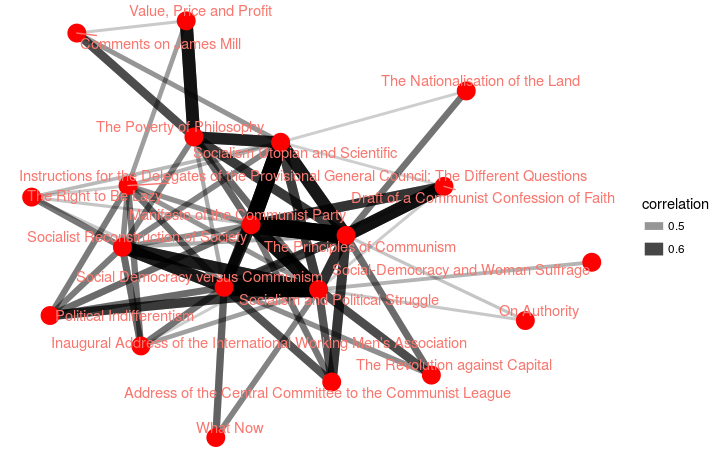
This chart examines correlations within the texts. Similar to the authors diagram, the nodes of the network represent individual texts and edge thickness indicates the degree of correlation, connecting documents which share similar terms and frequencies.
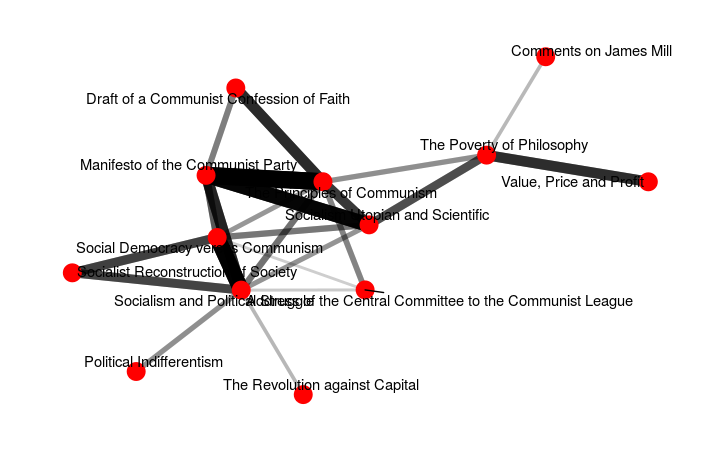
This diagram places the network on display. Although the nodes are the same, the correlations and thickness differ, illustrating correlations above 0.5. This filtering allows us to focus on more strongly correlated texts.
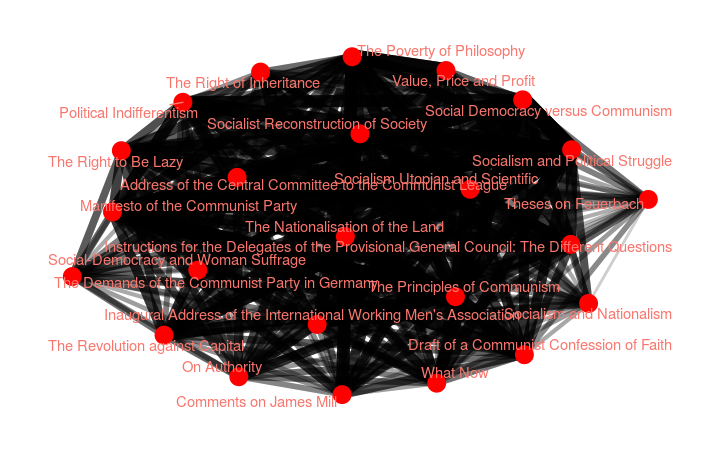
The graph above demonstrates what happens when all correlations are greater than 0.1. Without filtering, the network becomes so cluttered that the user is unable to perceive relative correlation strength.
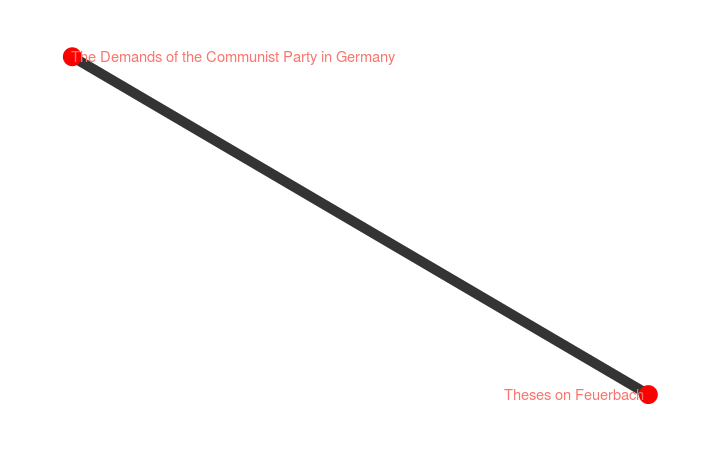
Filtering below a level of 0.1, we can see works that are weakly correlated. This reveals the weakest correlation, between The Demands of the Communist Party in Germany and the Theses on Feuerbach.
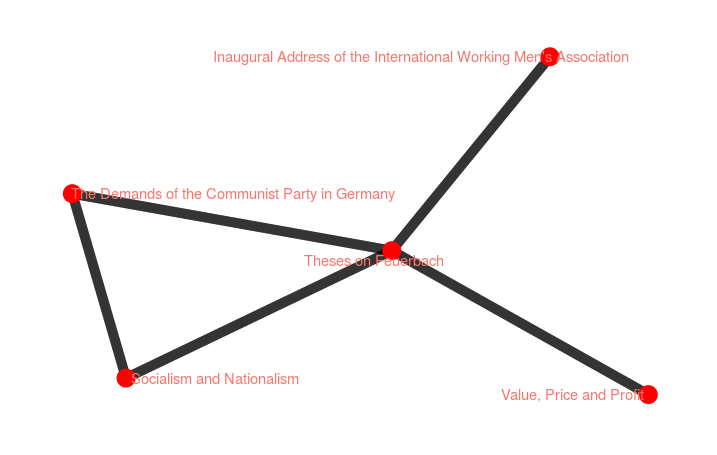
Above are more weakly correlated texts, below a 0.15 level.
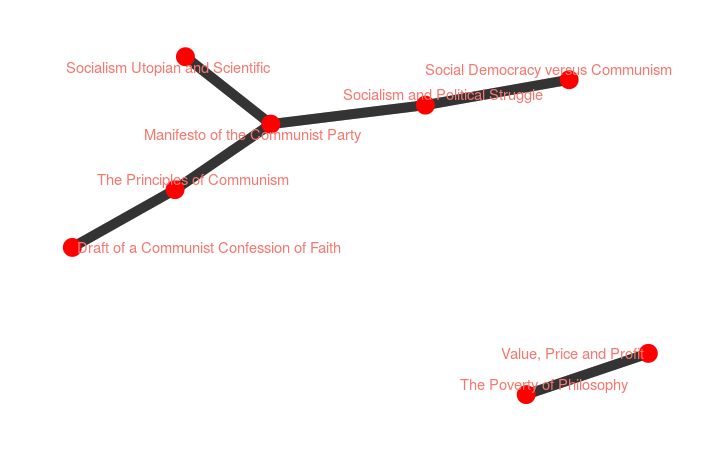
Taking a different approach, this last diagram illustrates the strongest correlations within the texts, at a level of 0.6. It reveals a disconnect between two groups: Value, Price and Profit is correlated at approximately 0.6 or higher to Poverty of Philosophy, but does not share a strong correlation with any of the other works.