Uncovered Questions

After experimenting with the Interrogating Marxism apps, I came up with some intriguing questions:

  1. It is clearly apparent on the Neatline map at http://adiuva.me/neatline/show/interrogating-marxism that most of the red spots that represent the Marxist works in the database for this website are in countries like Britain, France, Germany, and so on. In other words, it seems that a lot of the works were written in Western Europe. Is this true of other Marxist works? And then it is so interesting that a lot of the former Socialist countries were in Eastern Europe, rather than the west, where a lot of our representative Marxist works were written. Why is that? And what about the text from United States? Where is it located in the U.S., and what happened there? Why was it written there? Is there strong Marxist influence at that place today?
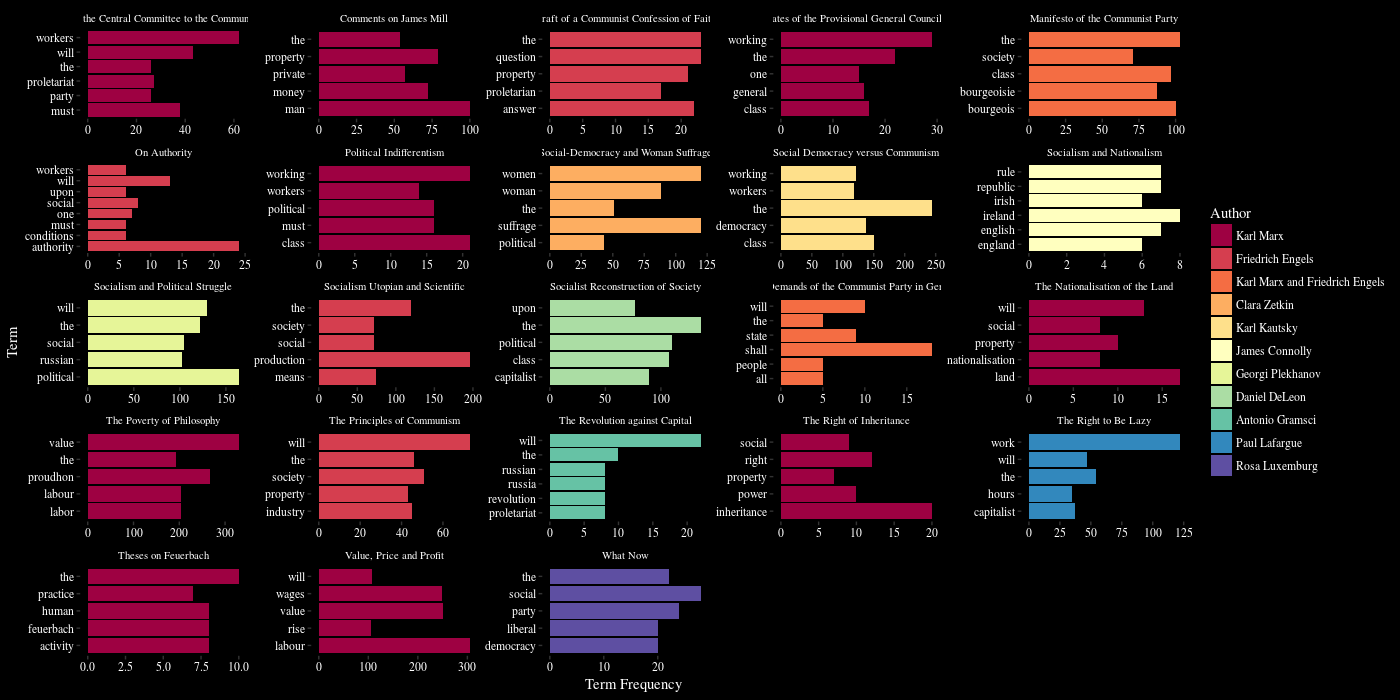
  2. In the Ngram frequency results, if we skip all the “stop words” (such as “is, they, and” and so on), the word bourgeois ranks quite high on the list, with a frequency of 331 and a relative frequency of 0.132503%. I found myself quite curious: Why is this word getting so much attention from the Marxist authors? Continue reading

A Digital Collection

As part of our ongoing experiments in visualization, I recently rebuilt a personal website using Omeka (or more specifically what they’re now calling “Omeka Classic”), a lightweight web publishing platform for digital collections from George Mason University’s Roy Rosenzweig Center for History and New Media. Previous exposure suggested that, by itself, it could make a decent digital asset management add-on to an existing site due to its metadata support. In this instance I wanted to discover the benefits Omeka offers when treating our corpus of plain text files as an online collection.

As it happens, there are a number of very nice plugins extending the functionality of Omeka, and several are specifically designed for text analysis and visualization. With the file content attached as an item type metadata (in this case the textual component), I was able to use the Ngram plugin to analyze term frequency and plot it over time.

Continue reading

What Keywords Interest You?

From the user perspective, what keywords about Karl Marx are you interested in looking at on our website? What aspects of Marx’s life do you find more interesting? Political economy? Technology? Workers? Cats?

Where do you think Marx wrote more books? Paris? Brussels? London?

Research shows that an audience influences how a writer creates their work. I think the same applies when creating a digital project — knowing what questions our audience is interested in will inspire us in ways we never imagined.

If you happen to be visiting the website, please share your thoughts and tell us what you want to know about, or know more about, Marxism.

Thank you! 😺


Keywords in Context

One of the initial project goals was to provide a means for examining the text using keywords, or more specifically a variation on the tools designed for “keywords in context” (KWIC). This technique involves generating a concordance, a list of the words used within a text along with those words immediately surrounding them, as a means for providing context. Traditionally, generating a concordance was a labor-intensive process reserved for only the most important books, often source texts that serve as the foundation for religion, such as the Judeo-Christian Bible.

As a linguistic tool, examining the collocation of terms and their respective uses across a corpus can provide valuable research insights, and with the advent of digital text analytics applications generating these annotated corpora became significantly faster and more accessible.

It was our hope that, when applied to our collection of Marxist writings, the results could also have pedagogical value: By searching for a keyword of personal interest, perhaps drawn from current events or an unrelated research interest, a scholar unfamiliar with Marxism could gain insight from how the terms were applied, resulting in something of a “Marxist perspective” on the topic.

Continue reading

Improvements and Interactions

In addition to experimenting with new visualization techniques, Sebastian produced an improved version of the “Top 5 Terms” chart:
Revised Top 5 Chart
Clearer and less visually cluttered, this version makes it easier to distinguish which terms were used most frequently by each author within each document.

Particularly engaging is the 3D interactive force network diagram he produced using the network3D R-to-JavaScript library. It features correlations of 0.4 and higher, and you can interact with the nodes, rotating them to bring a particular work into focus while highlighting the connections between texts.  Based on this degree of interdependence, it’s interesting to see Clara Zetkin as an outlier, only connected to Georgi Plekhanov.

Please take a moment to visit and explore the diagram, and let us know what you think.

Network Explorations

Another possibility for visualizing relationships between texts is to consider how similar the combinations of related terms among them can be. To accomplish this, experiments were conducted generating network diagrams.

Author Network

This diagram uses pairwise correlations to examine the term frequencies in each author’s work, via the tidygraph and ggraph R packages. The nodes represent authors, with edge density indicating correlation strength — how strongly related variables are, using values between 1 (strongly related to the point of being almost identical) and 0 (not connected or dependent at all). To reduce visual clutter, only correlations higher than 0.4 are considered. Based on this criterion, one possible interpretation of the graph suggests that Kautsky used similar terms at a similar rate as Engels.

Continue reading

Initial Experiments

The initial data corpus for this project is composed of twenty-five files, formatted using UTF-8 (8-bit Unicode) character encoding as both plain text and XHTML. These were produced using materials hosted by the Marxists Internet Archive, through a process of carefully cleaning the content via regular expressions.  Extraneous presentational markup and line endings were removed, and replaced by semantic markup where applicable.

XHTML was selected because, as a markup language written according to the XML standard, it supports incorporating additional metadata. For this project we wanted to include information about the location where a document was originally written as well as the date, and this was accomplished using a set of elements defined by the Dublin Core Metadata Initiative. For example, Marx and Engel’s Manifesto of the Communist Party was created in Brussels, Belgium, in February of 1848, so the XTHML version contains the markup:

<meta name="DC.date" content="1848-02-21" />
<meta name="DC.coverage.x" scheme="Point" content="4.3333" />
<meta name="DC.coverage.y" scheme="Point" content="50.8333" />

Continue reading